
- Sep 21, 2022
- 6 minutes
Written By
- Julien Herzen
Hierarchical time series represent things such as sales of different products, in different stores, belonging to different divisions. When forecasting future values of such time series, we are often interested in obtaining reconciled forecasts — that is, forecasts where the different values add up as they should. For instance, we want all our individual products’ sales forecasts to add up to the forecast of the total sales. Since most forecasting models do not enforce this when producing the actual forecasts (although there are exceptions), it is common to resort to post-hoc reconciliation techniques as a way to modify the forecasts after they are obtained, in order to reconcile them. In this article, we will show how this can be done simply using the Darts open source time series library. All the code needed to run this example is accessible here in a self-contained notebook.
We will use the Australian tourism dataset (originally coming from here), which contains monthly tourism numbers, disaggregated by region, travel reason and city/non-city type of tourism. The reconciliation itself will rely on techniques presented in Rob Hyndman’s book.
Loading the Data
Below, we load a single TimeSeries, which is multivariate (i.e., contains multiple components). We simply use the AustralianTourismDataset Darts dataset for simplicity, but we could also use TimeSeries.from_dataframe(df), providing a DataFrame df containing one column per component and one row per timestamp.
This series contains several components:
- One component named
"Total", - One component per region (
"NSW","VIC", etc) - One component per tourism reason (
"Hol"for holiday,"Bus"for business, etc) - One component per (region, reason) pair (named
"NSW - hol","NSW - bus", etc) - One component per (region, reason, <city>) tuple, where <city> is either
"city"or"noncity". So these are components named"NSW - hol - city","NSW - hol - noncity","NSW - bus - city", etc.
Let’s plot a few of those:
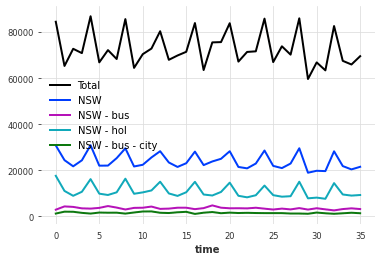
A few components of our multivariate TimeSeries.
Inspecting the Hierarchy
Some of these components add up in certain ways. For instance, the sum of the holiday tourism done in New South Wales can be decomposed as the sum of “city” and “non-city” holiday New South Wales tourism:
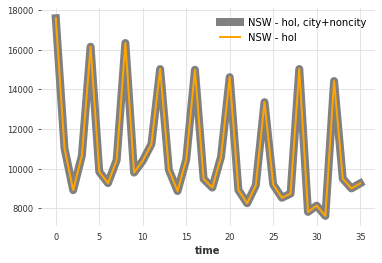
The number of “holiday” tourists in New South Wales decomposed as the sum of city + non-city tourists.
Similarly, both the sum over regions and over reasons add up to the total:
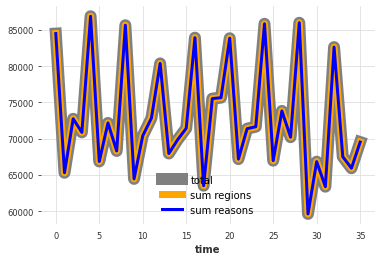
The number of tourists summed over all regions or all reasons is the total number of tourists.
So overall our hierarchy looks as follows:
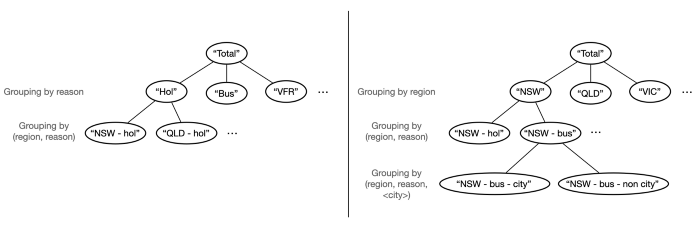
Our hierarchy is made of two main groupings — one per reason and one per region. (region, reason) pairs are further decomposed in city and non-city types of tourism.
Encoding the Hierarchy
We will now encode the hierarchy itself in a way that Darts understands. This is simple: the hierarchy is simply represented as a dict, where the keys are component names, and the values are lists containing this component’s parent(s) in the hierarchy.
For example, referring to the figure above:
"Hol"is mapped to["Total"], as it is a child of"Total"in the left tree."NSW - hol"is mapped to["Hol", "NSW"], as it is a child of both"Hol"(in the left tree), and"NSW"(in the right tree)."NSW - bus - city"is mapped to["NSW - bus"]as it is a child of"NSW - bus"in the right tree.- etc…
So all components except "Total" will appear as a key in the hierarchy dictionary. As we have quite a few components (96), we will not build this dict by hand, but rather programmatically:
As a sanity check, let’s see what a few of the components map to in the hierarchy:
Hol -> [‘Total’]
NSW – hol -> [‘Hol’, ‘NSW’]
NSW – bus – city -> [‘NSW – bus’]
Good, that looks as expected.
In Darts, hierarchies are a property of TimeSeries objects. We can now embed our hierarchy in our TimeSeries. We do this using the with_hierarchy() method, but we could also specify the hierarchy at the series construction; for instance providing a hierarchy to the TimeSeries.from_dataframe() factory method.
Forecasting Using a Multivariate Model
Now we have a multivariate time series, which contains the hierarchy information. Let’s split it in train / eval parts. We will keep the last 12 months as a validation set.
Getting forecasts is now as easy as using one of Darts models supporting multivariate series:
Let’s look at our forecasts:
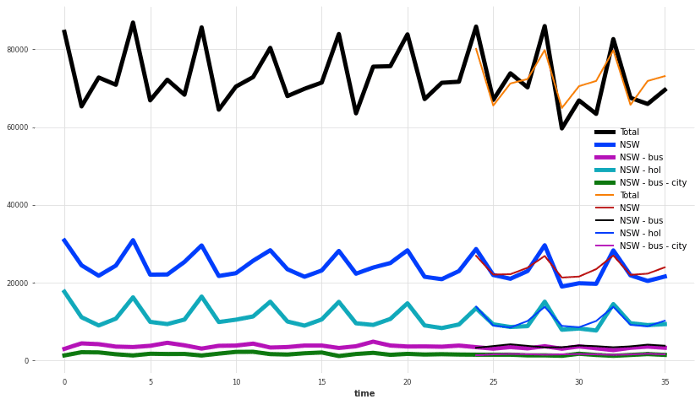
The forecasts obtained for a few of the components of the series.
Let’s also compute the accuracy at the different levels (MAE, averaged over several components):
mean MAE on total: 4141.65
mean MAE on reasons: 1275.43
mean MAE on regions: 799.99
mean MAE on (region, reason): 312.05
mean MAE on (region, reason, city): 189.69
Reconciling Forecasts
First, let’s see whether our current “raw” forecasts add up:
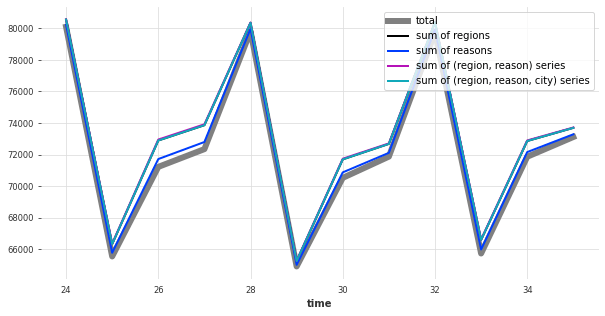
Our raw forecasts don’t exactly add up as we would want them to.
It seems that they don’t. So let’s reconcile them. We will use some transformers available in darts.dataprocessing.transformers to do that. These transformers can perform posthoc reconciliation (i.e., reconcile forecasts after they have been obtained). We have at our disposal the following methods:
BottomUpReconciliatorperforms bottom-up reconciliation, simply resetting each component in the hierarchy as the sum of its children components (API documentation).TopDownReconciliatorperforms top-down reconciliation, which breaks down the aggregate forecasts down the hierarchy using historical proportions. This transformer requires callingfit()with the historical values (i.e., the training series) in order to learn these proportions (API documentation).MinTReconciliatoris a technique to perform “optimal” reconciliation, as detailed here. This transformer can work in a few different ways listed in the API Documentation.
Below, we use the wls_val variant of MinTReconciliator:
Let’s now check whether the reconciled forecasts sum up as we expect:
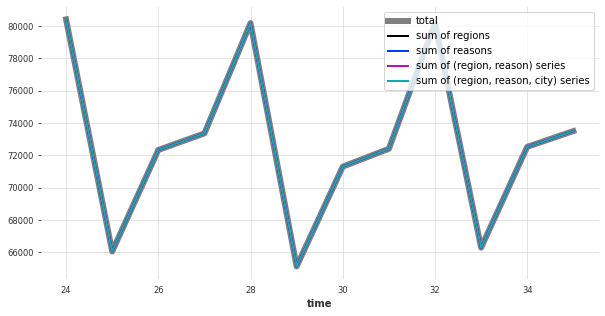
Our reconciled forecasts now add up exactly as they should.
It looks good — and how about the MAE errors:
mean MAE on total: 4168.35
mean MAE on reasons: 1288.50
mean MAE on regions: 781.98
mean MAE on (region, reason): 309.29
mean MAE on (region, reason, city): 188.89
Compared to before, the MAE slightly increased (e.g., on the total level), whereas it slightly decreased on some other more granular levels. This is typical of reconciliation: it can increase the error, but also decrease it in some cases.
Conclusions
Reconciliation is often an important step in order to produce coherent forecasts. In this article, we showed how this can be done easily with Darts, following these steps:
- Building a multivariate
TimeSerieswhere the univariate components represent elements of the hierarchy. - Encoding the hierarchy as a
dictwhere each component points to its parent(s) in the grouping(s). Embed this hierarchy into theTimeSeriesusingwith_hierarchy(). - Getting a raw forecasts in 3 lines of code using one of Darts multivariate models — simply calling
fit()andpredict()on the multivariate series. - Reconciling the forecasts using a Darts “reconciliator” transformer, and calling
fit()andtransform()on it.
That’s it! Do you have challenging forecasting problems? Don’t hesitate to reach out! We hope you found this article helpful to reconcile your own forecasts.