- Jan 18, 2023
- 11 minutes
You may have heard about Palantir Foundry in recent years. Do you know what it is? In the Foundry documentation, you can see phrases like “closed-loop operations”, and “connecting data, analytics, and business”. Let us create a new definition. Foundry is an operational platform that holistically encapsulates your data processing, analytics, BI and ML needs as well as allows for informed decision-making for both technical and non-technical members of your organization. It consists of two distinct layers: the data layer and the operational layer.
At some point in the life of a company, there comes a time to build a platform to enable operations like:
- Viewing and editing your data (whether it’s sales data, analytics data, operational data, or any other)
- Provide tools for easy construction of new datasets derived from the original data #dataengineering
- Control who can access which data #datasecurity
- Ensure that data meets the requirements and is properly cleaned of faulty data #dataquality
- Making data-driven decisions thanks to interactive dashboards and reports #datavisualization
- Take the next step in their data journey with the help of machine learning models, whether it’s forecasting the growth of the company or recommending products to a user #ai
Palantir Foundry is a platform that allows you to do that and much more. It consists of many services similar to your standard cloud provider. This article will cover some of Foundry’s offerings, such as the data analysis tool Contour, the solution to track the history of the data called Data Lineage, the service enabling business users to make data-driven decisions named Ontology, as well as the data application creator Workshop. However, to be smoothly integrated these services need to speak the same language. In Foundry the building blocks of that language are Datasets.
Datasets
If you work with databases you are familiar with tables. When you use Google Sheets or MS Excel you know spreadsheets. They are data abstractions – they encapsulate data and give them structure. Foundry’s most common data abstraction is the dataset. You can create a dataset by uploading a file, for example in a CSV format, importing data from another system such as SAP, or transforming existing datasets via Foundry services. A remarkable feature of datasets is that they have a unique way of being created. Even when having the same schema you are not allowed to modify the existing dataset using a different set of upstream transformations. This constraint means that by looking at a particular dataset you can always know how it was created, and quickly jump to see the details of the code responsible for doing it.
After importing some of your existing data you probably want to apply some transformations. Foundry uses Spark as the runtime engine for your transformations. You have a handful of solutions to create data transformations and apply them to your existing datasets to create new ones. The primary services to do that are Code Repositories and Contour. Code Repositories are the most production-like way of manipulating the data. You write PySpark or Spark SQL code which accepts inputs and writes to a single output. Code Repository is the Git repository underneath; you can clone it to have a local view of your code. This service is the way to transform the data in production but may be cumbersome if all you need is a service to analyze the data and possibly create a copy of your analysis output. The tool that shines in this regard is Contour.
Contour
If you’ve been in the data world for some time, you used or heard about Jupyter Notebooks. These are interactive Python environments divided into cells, which combine the benefits of quick evaluation of the REPL interfaces and the advantages of working on a file where you can quickly scroll up and see what you have done in the past. Contour is the next generation of data analysis. With a similar cell structure, you can add new data transforms, such as adding or removing columns, joining two different datasets, and quickly visualizing the data with various charts. In Contour you don’t write PySpark nor SQL but select from a set of predefined transformations in a no-code / low-code fashion.
The tool is very intuitive and helps you with your analysis as you go. Imagine that at some point you want to create a histogram, for example, to see which of the aircraft carrier traveled the most distance. If you click on one of the bars it will dynamically add a filter for this carrier and your next cells will be recomputed. You can later on either remove this filter or add more carriers by clicking on their respective bars.
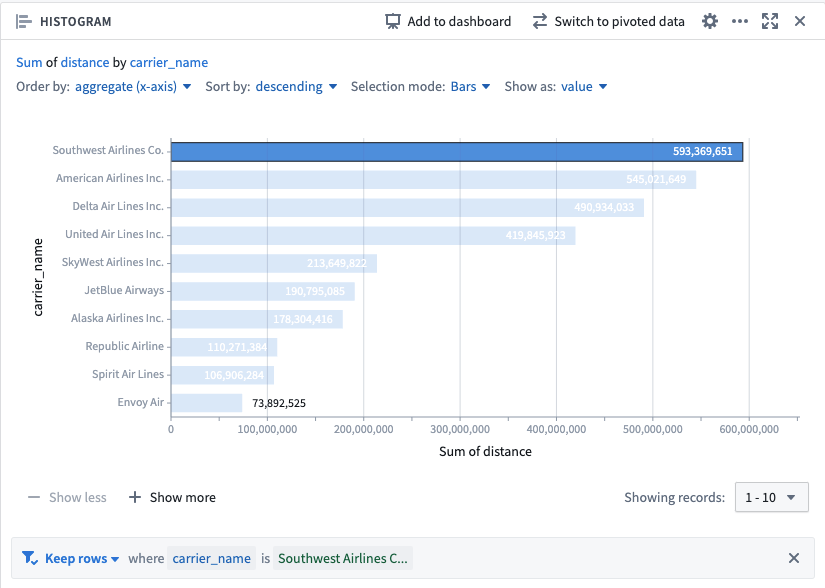
Contour analysis Histogram cell with selected bar
Contour is a great tool for exploration and analysis. It is also perfectly capable of saving the data as a new dataset, although it is not recommended to be included in production pipelines. It is an interactive gadget that can help you understand the data quickly, visualize it to a fair degree or find these few weird rows that messed up your transformations.
Data Lineage
With an ever-growing volume of datasets, it is easy to get lost. Where is this data coming from? Is this the original dataset, or is it derived from different datasets? What is the source of truth? Which datasets should I use in my transforms? These are examples of the questions a common concept known as data lineage aims to address. Data lineage is about presenting in a clear and intuitive way the graph of datasets and transforms to understand what are the inputs and outputs of the transforms.
Data Lineage graph
With Lineage, one of many services on the Foundry platform, you can create and edit interactive visualizations of connected datasets. Moreover, you can save these visualizations to allow others to use and edit them later. Since Lineage is one of the Foundry services, it includes information about the downstream usages of datasets, such as Workshop Apps or Ontology Objects (see later sections of this article for more details on those).
Lineage allows color-coding your data transforms to visually separate distinct groups. You can use automatic color-coding mechanisms (eg. based on the type of the transform) or you can manually assign colors. You can hide or show the transforms depending on your needs. And if you create a tangled mess with a drag-and-drop interface, you can always turn to actions that sort and order your transformations in a predefined way, for example, bottom-up or from left to right. Moreover, since each dataset is created uniquely from Lineage, you can trigger the build of a dataset and all of the datasets that come before or after the current one. And if you know you need to rerun the build now and then, you get the ability to define schedules that trigger the build either at a certain point in time or when the contents of the dataset change.
Lineage files, therefore, are an indescribably powerful tool to help you understand and manage your graph of transforms.
Ontology
Although the concept of ontologies is not new, the Foundry platform is the first major provider to include it as one of its core services. Before diving into the details of Ontology, let’s paint a picture.
Imagine you work with data in an aviation company. You have your data transforms, which create various datasets:
- Flights – e.g., airports and local times of departure and arrival, etc
- Passengers – e.g., passenger numbers, class
- Aircraft – e.g., details about the plane models the company has
This data exists in relation to each other; for example, Aircraft is in a relationship one-to-many with Flights because one plane can be used for many flights. Passengers are in a relationship many-to-many with Flights because one flight has many passengers, but also one passenger can travel by plane many times.
This is all good unless unexpected circumstances happen, for example, a passenger cannot join the flight. Your dataset did not include that information, and there is a discrepancy between your dataset and the reality. Moreover, people in your company’s customer service, who received the information that the passenger did not attend the flight, are not technical users; they cannot open up transforms and modify filters to exclude this passenger. You want to provide a way for non-technical users to engage with the data, but on a domain level they understand, not on the technical level of datasets and transforms.
This is where the Ontology framework comes in. It allows the definition of Object Types, Link Types, and Action Types. In our aviation example, we would create three Object Types: Flight, Passenger, and Aircraft. These would be backed by datasets containing the respective data. Then we would define the relationships between them. Aircraft should have links to the Flight objects — it would be a one-to-many Link Type. Passenger to Flight would constitute many-to-many Link Type. With Object Types and Link Types in place, we can now proceed to define Action Types. Remember the customer service person needing to report the change in plans and a missing passenger? We can now add Remove Passenger Action Type to our Ontology Layer. Action Type, like a method in object-oriented programming languages, will be defined on top of the existing Object Type. This means that we can define this Action Type on Flight Object Type so that anyone seeing a Flight Object can call Remove Passenger Action providing the passenger id which should be removed.
The Ontology layer, therefore, lies on top of the data layer. The world of datasets is the world of data analysts and engineers. Once they are done with the data it should be clean and prepared for its life in the world. That’s when it is added as Objects to an Ontology where business teams can use it to drive impactful data-based decisions.
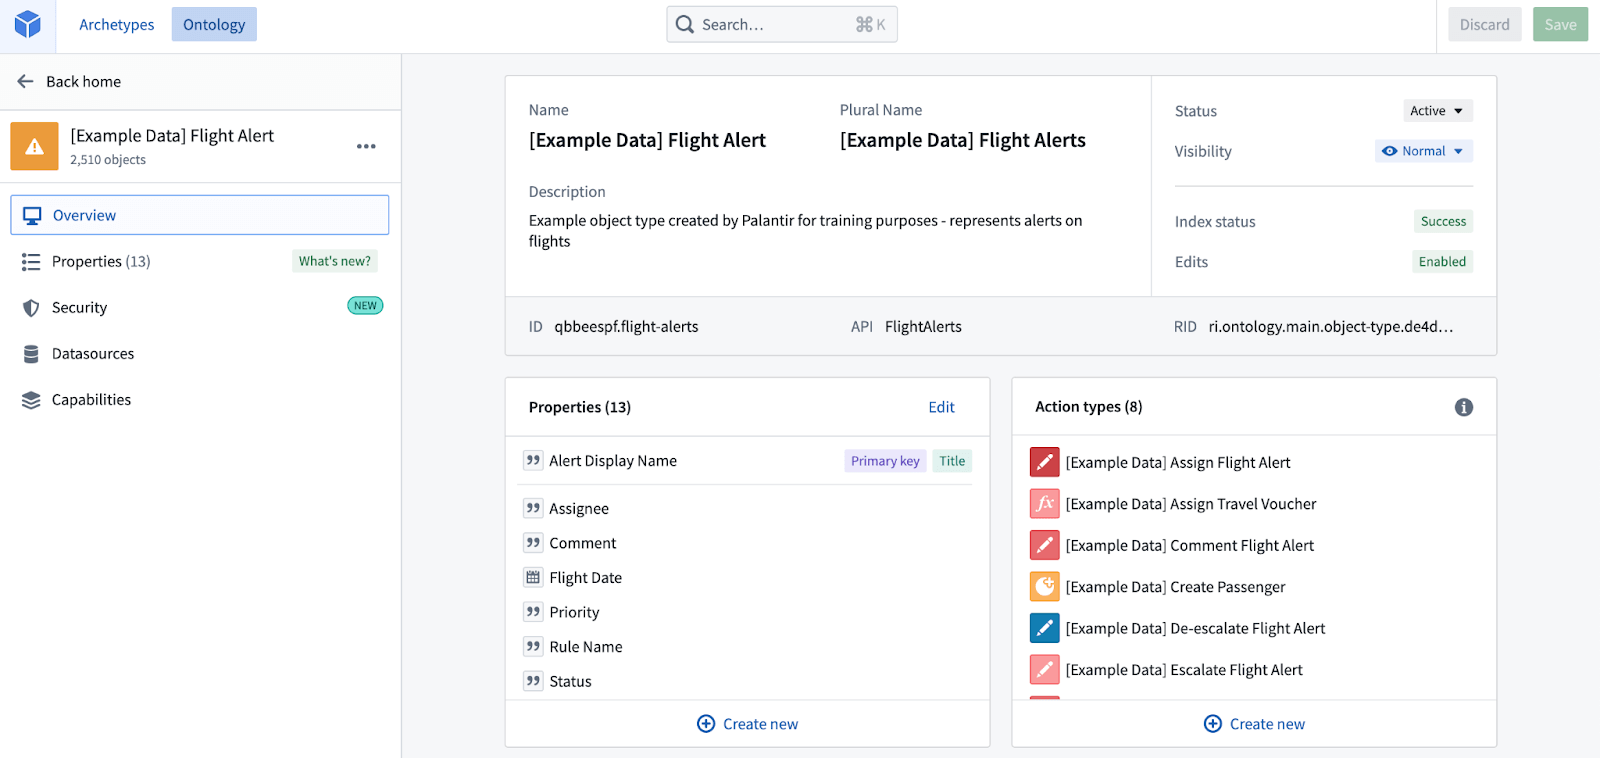
Ontology Object Type “Flight Alert”
Okay, but how should such an Action be performed? We’ve mentioned that these Actions are a way to allow non-technical Foundry users to interact with the data. The Actions themselves need to be exposed via an easy-to-use interface. There are several options on the Foundry platform but in our case, let’s talk about Workshop applications.
Workshop
At some point, you must present the data in a digestible form to business users. Typically what you would use for such a presentation would be a dashboard. Foundry is capable of creating such visualizations either via Contour or Quiver. However, if you want more interactivity within the presentation layer, aim for Workshop.
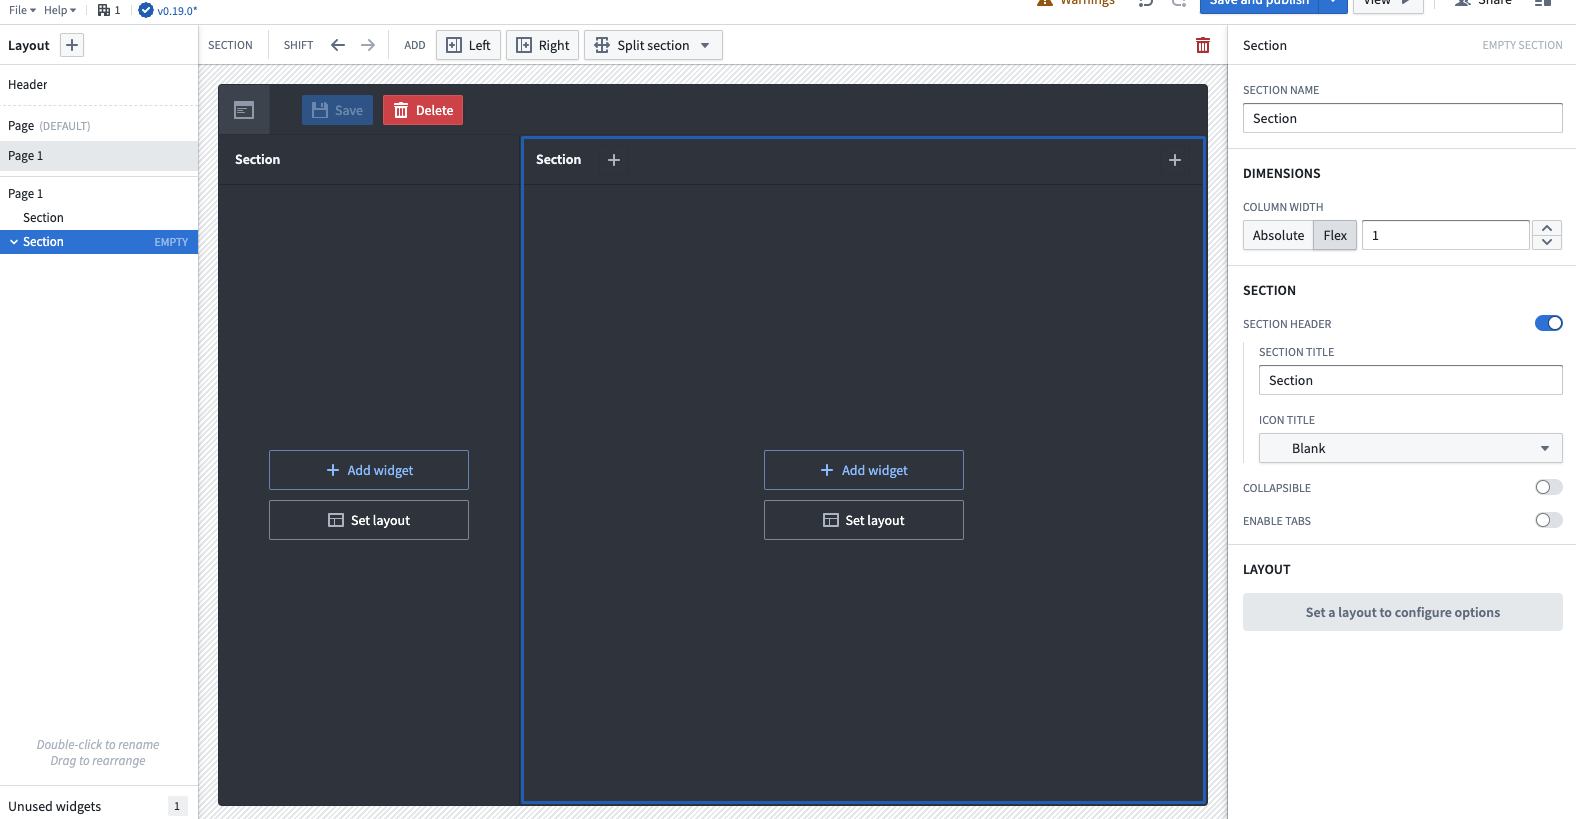
Workshop Application Creator
Workshop can create data-driven applications through various widgets for different use cases. When you make a new application, you’re faced with a canvas divisible into sections. In those sections, you can add widgets such as Object Table used for visualizing and editing the data in tabular format or charts such as “Chart: XY” for bar charts or “Chart: Pie” for beloved round ones. Moreover, you get a ton of flexibility with filters you add to your tables or buttons and their associated actions. The Workshop application is capable of providing more than one page, which is equivalent to the screen. You can add logic to link from one page to another, open custom overlays and more. The Workshop serves as a tool to create web applications with no CSS or HTML editing, just by stacking up your widgets in an easy-to-use environment. This is vastly superior in terms of development speed; you can create a nice-looking page in no time compared to building something from scratch using React or Angular. However this speed boost comes with a cost, you are constrained in terms of the content of your application. You can use available widgets but embedding an external view is not possible.
Remember our aviation example with the Removing Passenger dilemma? Here’s what you could do with Workshop. Create an Object Table to visualize Flights Objects. On top of that table, add a Button that would execute the action Remove Passenger. The user can select a proper Flight row in the table, press the button Remove Passenger, and provide the passenger id in a dialog form that pops up. After submitting the Action, the passenger will be removed. The end user does not need to know anything about underlying components and can still interact with the data.
Summary
At Unit8, we have delivered 40+ projects on Foundry. The platform has helped us deliver quickly on complex use cases, thanks to its data platform capabilities we were able to transform and analyze the data rapidly. With the help of Foundry’s operational layer, we created tools for our clients to engage with data and make data-driven decisions daily.
With an ever-growing set of Foundry services, we aim to expand this list to enable a quick run-down of other service capabilities.