- Nov 23, 2021
- 9 min read
Written By
- Francesco Lässig
When it comes to astronomical objects, humanity has achieved almost oracle-like abilities to predict their future behavior: Whether it be the time of the next solar eclipse or the position of comet Halley in 100 years, we can forecast these values with very high precision. The same cannot be said, however, for most other quantities that are relevant for our society. If you want to know the traffic to your website in 7 days, or the deer population in Texas in 2 years, there is no easy formula that will give you an exact solution. You can always train a forecasting model on historical data and predict a certain value, but this will never be more than a (hopefully) reasonable estimate. The future is shrouded in mist, and anything that you think you are seeing beyond it is associated with uncertainty.
We built Darts to predict more than just astronomical phenomena, and in this article, we will explain how you can use probabilistic forecasts to get a handle on uncertainty in your predictions.
If you’re new to Darts, please check out our introductory blog post.
To illustrate the value of probabilistic forecasts, let’s take a look at some different approaches of predicting a time series with a variable noise component:
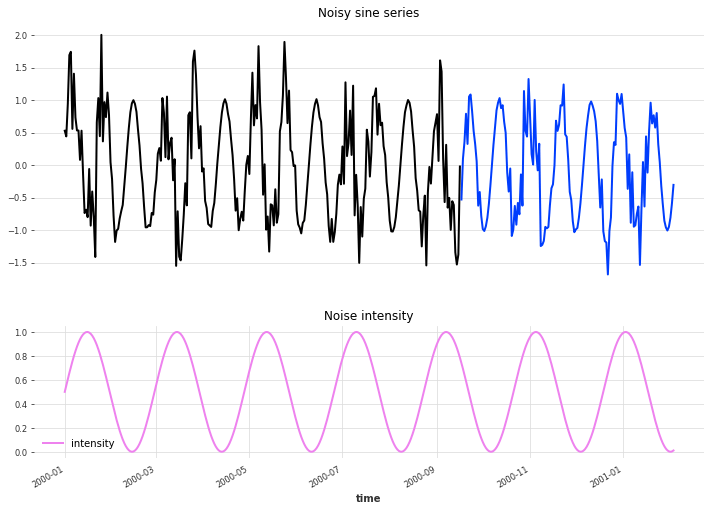
Variable noise component
The time series on top represents the quantity that we want to predict. It is an artificially created sine series with a variable gaussian noise component. What’s variable is the intensity of the noise, which itself is also described by a sine curve (although with a different frequency from the other one) as shown in pink. We want to predict the blue validation time series given the historical record in black, and given the knowledge of the noise intensity both in the past and the future. Please note that, while this specific time series is artificial, processes that create varying noise intensities are found in many real-world scenarios (think of marketing budgets for instance).
Attempt 1: Naive Model
One of the simplest ways to create a forecast would be to use one of the naive baseline models of Darts, namely the NaiveSeasonal model. This model accepts a seasonal period as a parameter, and at prediction time simply repeats the last observed value that was at the same point in the seasonal cycle.
We can create a prediction in 3 short lines of code, given that we know the seasonality period of the time series.
naive_model = NaiveSeasonal(seasonal_period)
naive_model.fit(target_train)
naive_model.predict(n)
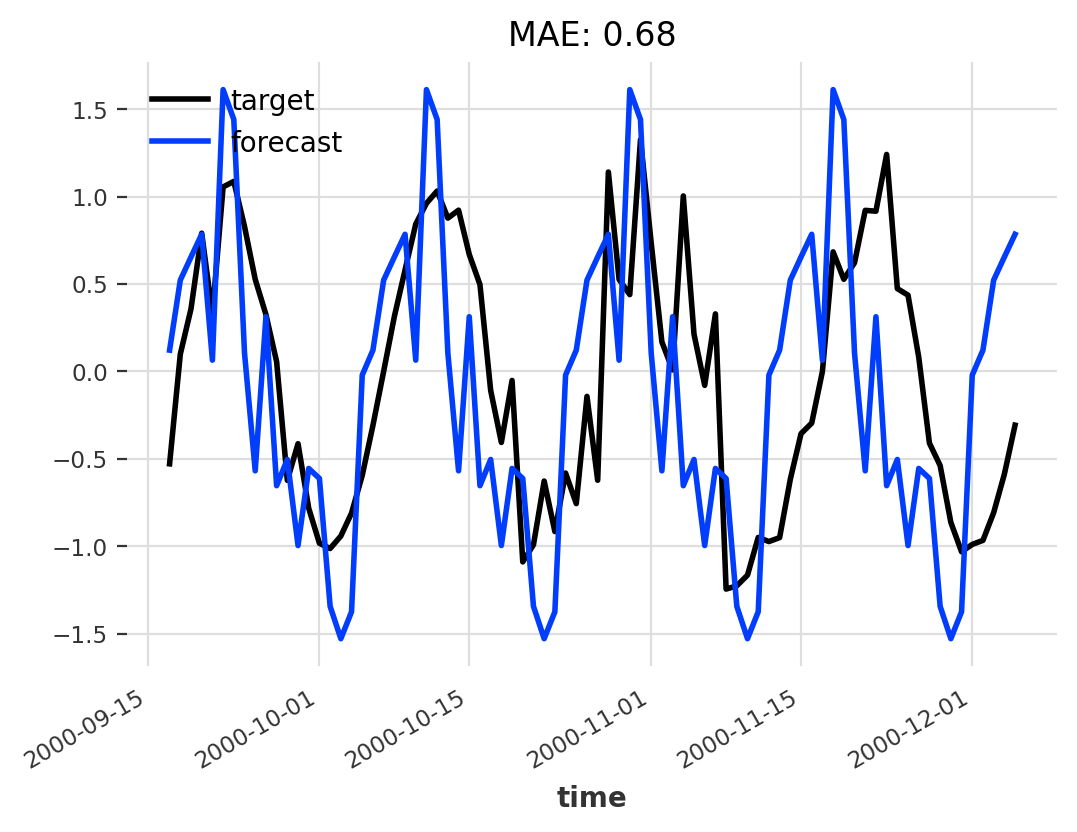
Naive Model
As you can see, this is not a very good result. The problem is that the model also predicts the same noise as it saw before, even though the noise is by definition not predictable.
Attempt 2: Autoregressive Model
Our previous attempt was unsuccessful because our model did not separate signal from noise. To address this issue, let’s try a more sophisticated forecasting model: A simple autoregressive model. For this, we can use the ARIMA model of Darts with a non-zero value for only the first parameter.
ar_model = ARIMA(seasonal_period, 0, 0)
ar_model.fit(target_train)
ar_model.predict(n)
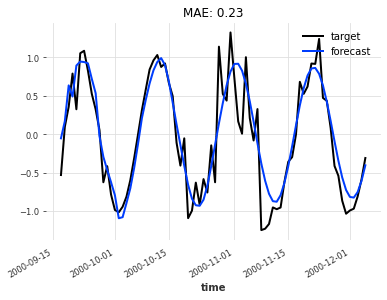
Autoregressive Model
This is much better. Our model pretty much extracts all the information it can from its input while disregarding the noise component. It would be hard to make a deterministic prediction that is significantly more accurate.
But if that’s the case, what are we still missing? Why do we need another type of forecast if we have already captured the signal? The issue with our current approach is that we have no way of knowing how certain we can be about a given forecast. Consider the following two point predictions.
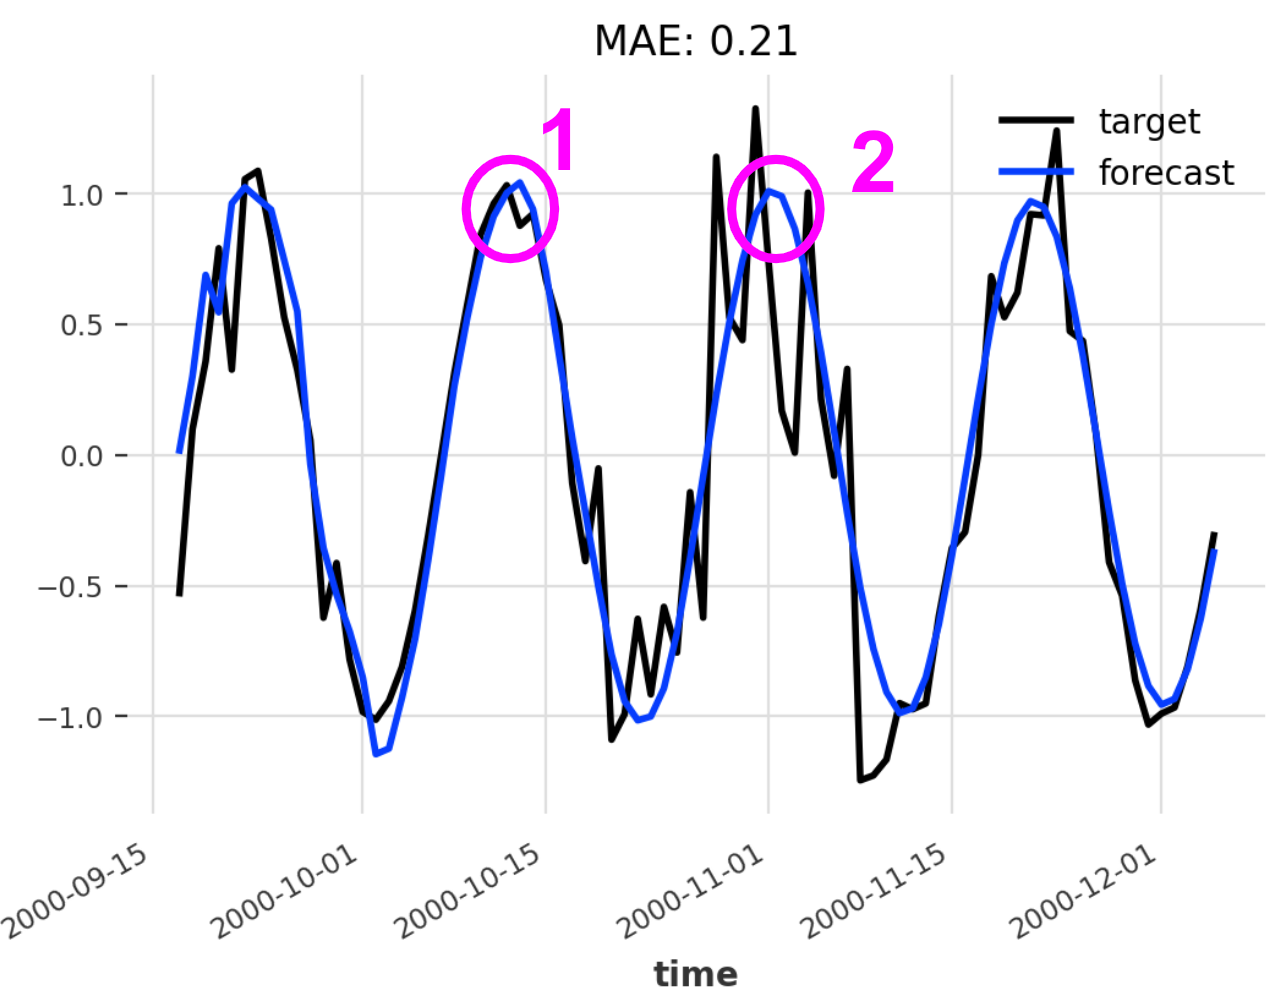
Two point predictions
Prediction 1 could be considered a ‘safe’ forecast because the noise component is weak at this point in time. In other words, we can be fairly certain that the ground truth value is close to our forecast. However, if we look at prediction 2, it is much more likely that it will deviate from the ground truth since the noise component is very strong here. Of course, this is obvious to us since we see both the forecast in blue and the ground truth in black. But in a real-world scenario, you would only see the blue line, which gives no indication about the fact that one forecast is much ‘safer’ than the other.
Attempt 3: Probabilistic Model
We want a prediction that doesn’t just provide us the value that, according to the model, is most likely going to be close to the ground truth, but we also want a measure for how certain we can be about that value. To do this we will use one of Darts’ deep learning models, the TCN, in its probabilistic form. To do that we need to make sure we specify the likelihood parameter when instantiating the model. And to produce a stochastic forecast, we need to set the num_samples parameter to an integer higher than 1. What these two things do exactly will be explained in the next sections.
prob_model = TCNModel(
input_chunk_length=seasonal_period*2,
output_chunk_length=seasonal_period,
dropout=0,
likelihood=GaussianLikelihood()
)
prob_model.fit(target_train, past_covariates=noise_intensity)
pred = prob_model.predict(n, num_samples=100)
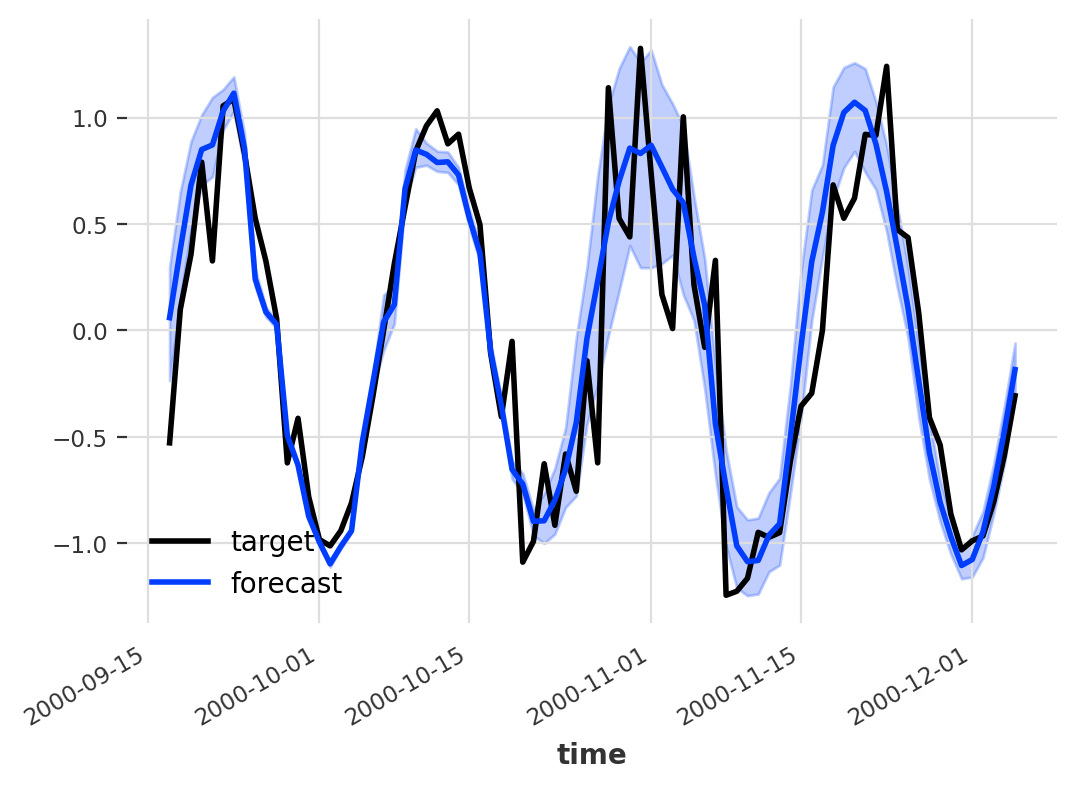
Probabilistic Model
Now we’re talking. In addition to one single value per time step which represents the most likely value according to the model (dark blue line), a probabilistic forecast in Darts also provides us with a measure of uncertainty in the form of confidence intervals (light blue area). The wider the confidence interval, the more uncertain the model is about its prediction. But what is happening behind the scenes when we create a probabilistic forecast, and how do we get these confidence intervals? To find out, please read on.
Deterministic vs. Stochastic Forecasts
A deterministic model, once trained, can be seen as a function that maps a given input series (and optionally covariates) to a deterministic forecast. A deterministic forecast in Darts is a TimeSeries instance with shape (length, num_components, 1) where length corresponds to the number of predicted time steps, and num_components represents the dimensionality of the time series at one specific point in time (which is equal to 1 for a univariate time series). In other words, given a point in time and given a time series component, there is exactly one value that fully describes the forecast at that point.
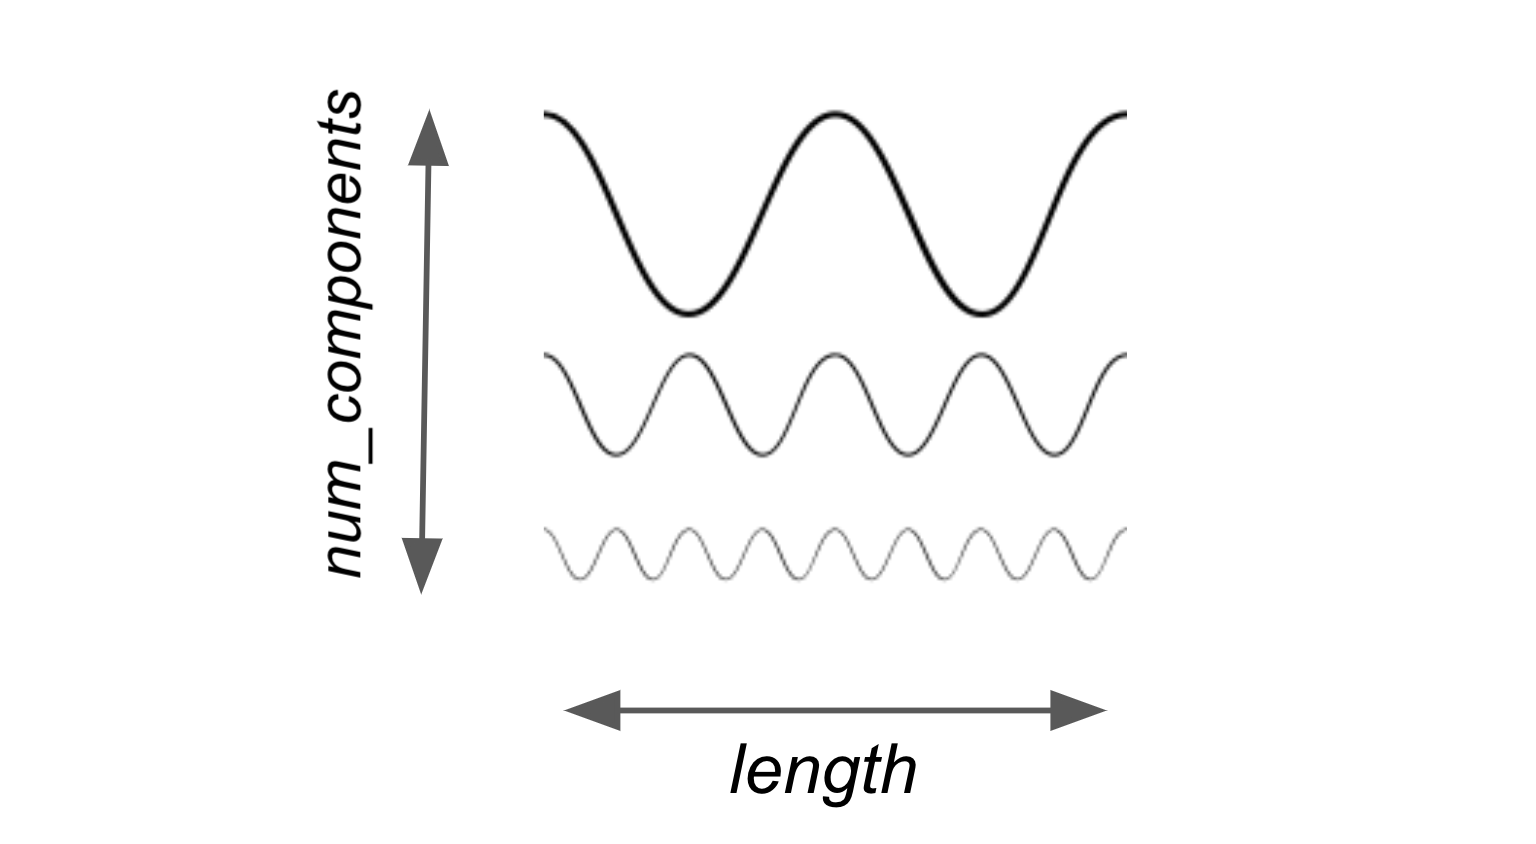
Deterministic time series in Darts
A trained probabilistic model, rather than a deterministic function mapping input to output, can be seen as a mapping of an input series to a random variable. However, since in general there is no guarantee of a nice analytic description of this random variable, the act of predicting will return samples from this random variable as a forecast. A probabilistic forecast is thus a TimeSeries instance with dimensionality (length, num_components, num_samples). The first two dimensions have the same meaning as in the deterministic case. The last dimension represents the different samples that are produced by the probabilistic model.
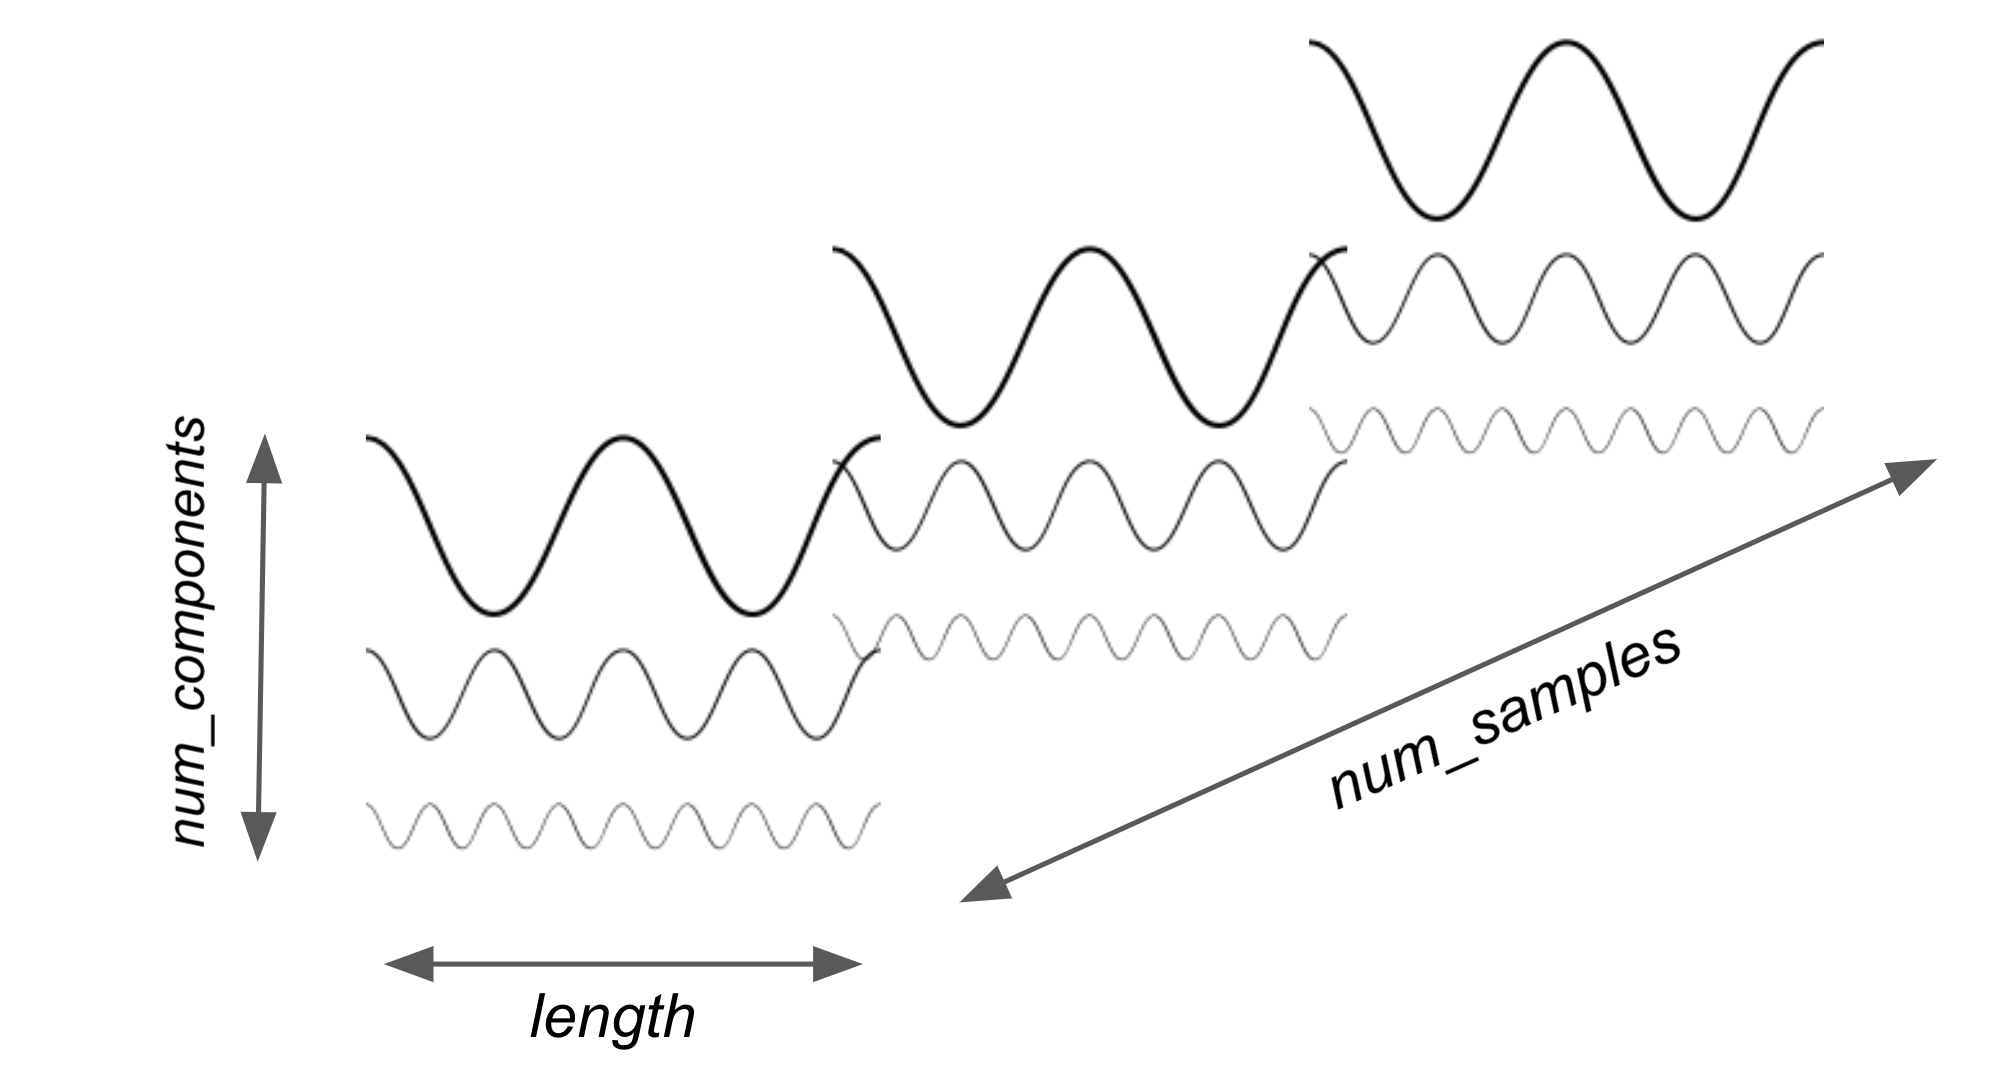
Stochastic time series in Darts
Each of the individual samples can be seen as a sample of the (length, num_components)-shaped random variable which is given by the probabilistic model and the input series.
The advantage of this way of representing probabilistic time series is the fact that it is distribution-agnostic. In other words, it does not matter how our model works internally, and it is not necessary to have a closed-form probability density function, as long as there is a way to draw samples from the distribution. The idea is that relevant statistics can then be computed as a function of these samples, more on that in the next subsection.
Now that we know how a probabilistic forecast is structured, we can understand how the forecasts of the previous section differed. When we created a deterministic forecast using our ARIMA model by calling model.predict(n), a time series with shape (n, 1, 1) was produced (since we were predicting a univariate and deterministic time series). When producing a forecast using probabilistic TCN with model.predict(n, num_samples=100), however, we produced a time series with shape (n, 1, 100).
Interpreting Stochastic Forecasts
Given a set of samples of the random variable defined by a probabilistic model together with an input series, we can compute statistics that help us estimate the ranges of values that we can expect a value in the future to assume. The most important statistic that is used in Darts to establish these ranges is the quantile.
Using the TimeSeries.quantile_timeseries(quantile) function, we can compute a new deterministic time series from a probabilistic time series which at every time step t is equal to the quantile quantile of all the values of all the samples at time step t. Let’s try this with the forecast we obtained in the first section using the probabilistic TCN model.
pred = prob_model.predict(n, num_samples=100)pred.quantile_timeseries(0.05).plot(color=’cornflowerblue’) pred.quantile_timeseries(0.95).plot(color=’lightsteelblue’)
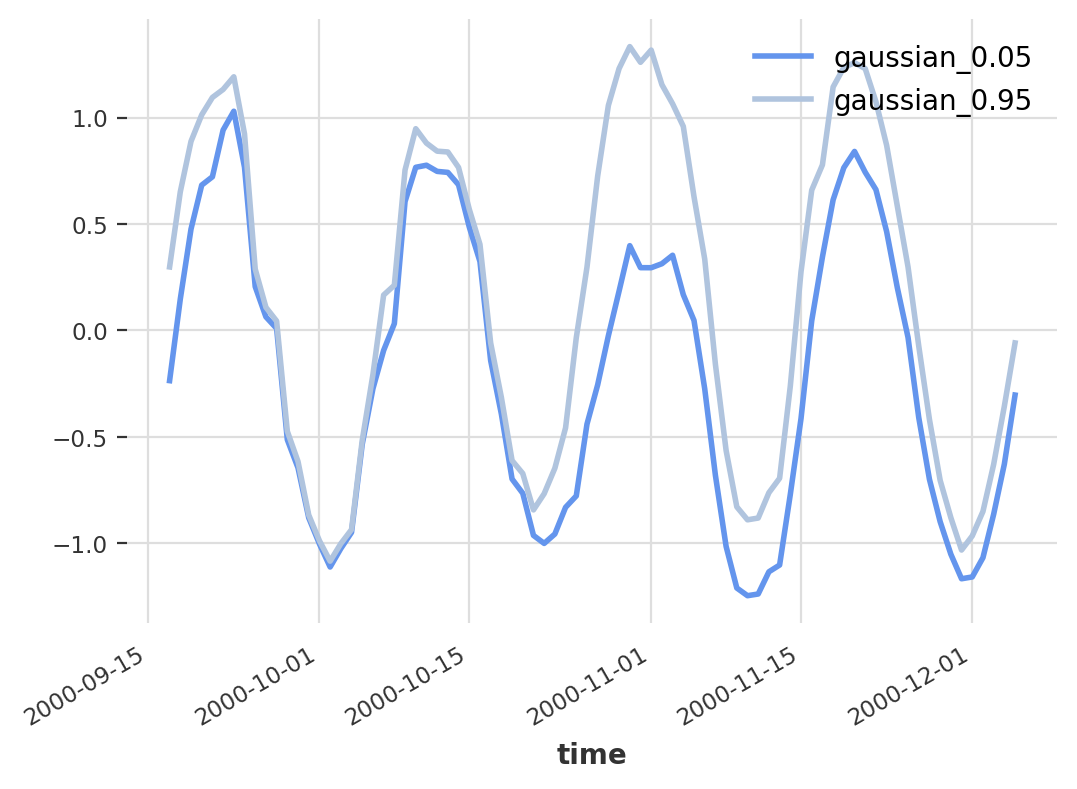
Plot of two quantile time series generated form a probabilistic forecast
You can see the point-wise 0.05 and 0.95 quantiles of our sampled time series. According to our model, we can expect 90% of the data to lie between these two lines. Hence, where the two lines are far apart, the model expresses more uncertainty. In other words, we have created an interpretable confidence interval!
To plot the time series that we are most likely to see, according to our model, we can compute the 0.5 quantile, which corresponds to the point-wise median of the samples.
pred.quantile_timeseries(0.5).plot()
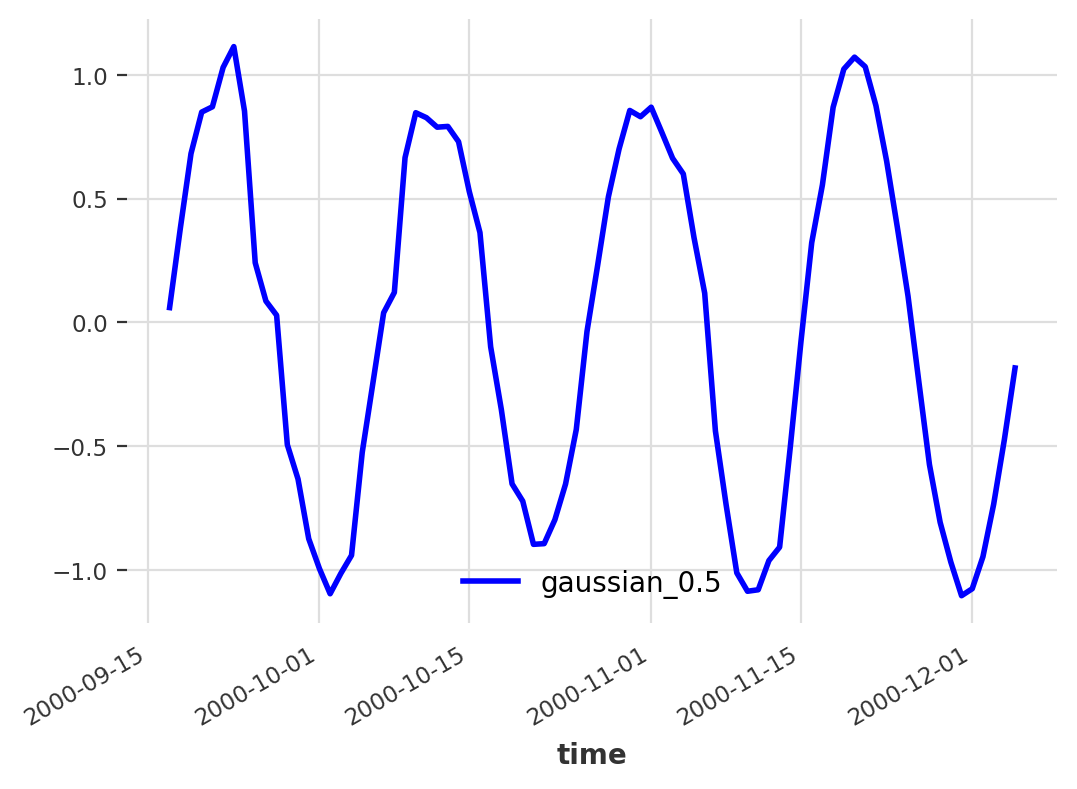
Plot of the median quantile of a probabilistic forecast
Since, in most cases, an upper and lower quantile + the median are the quantities that we are most interested in, Darts plots all of these values automatically when calling TimeSeries.plot() directly on the probabilistic forecast.
pred.plot(low_quantile=0.05, high_quantile=0.95, color=’blue’)
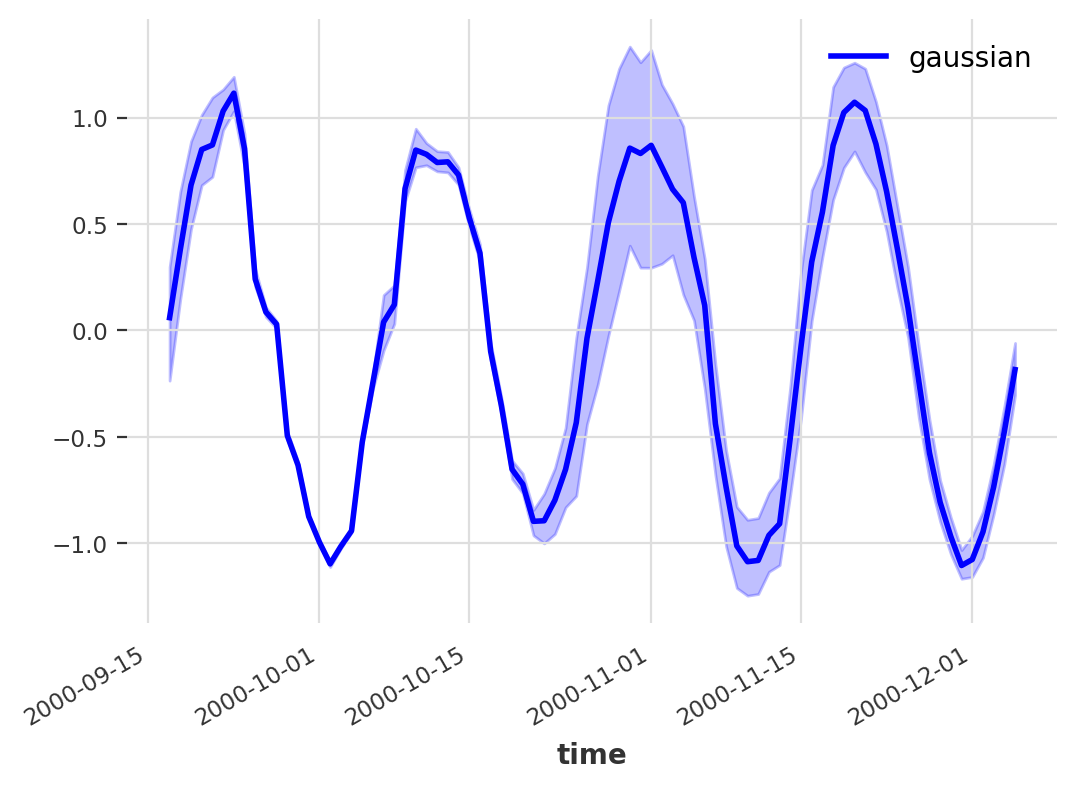
Probabilistic forecast plot showing median and confidence interval
ANNs and Likelihood Models
Up until now, we haven’t gone into the details of how exactly a probabilistic model in Darts captures stochasticity. That was done on purpose since we allow different models to have various mechanisms for this. ARIMA and ExponentialSmoothing allow sampling by running simulations of their state-space models with randomly sampled errors. Our deep learning-based forecasting models, on the other hand, model probability distributions a bit more explicitly using the Darts Likelihood class.
The idea of how probabilistic TorchForecastingModel instances in Darts differ from their deterministic counterparts, is that instead of predicting future values directly, they predict parameters of a given distribution, which should describe the likelihood of seeing a future value. The specific distribution that is used is defined by a Likelihood instance, which is passed to TorchForecastingModel.__init__() when creating the model (as we did in the first section with the TCN model). To be more precise, a Likelihood does 3 things:
- It defines how many parameters a
TorchForecastingModelhas to predict to model the distribution of one single output value. For a gaussian distribution, for example, this would be 2: one for the mean and one for the standard deviation. - It defines how the loss is computed as a function of the distribution parameters and an actual observation. This boils down to taking a numerically stable negative log likelihood of the given distribution of the observation.
- It provides a way to sample predictions from the distribution defined by the parameters predicted by the model and the probability distribution.
In addition to choosing a likelihood model from a vast selection of options, some Likelihood instances can additionally be parametrized with prior parameters to bias the model towards certain distribution. This can help with regularization and allow for controlling the degree of uncertainty a model should express.
Real-World Example
To see how you can use Darts to create probabilistic forecasts on real-world datasets, please check out our example notebook.
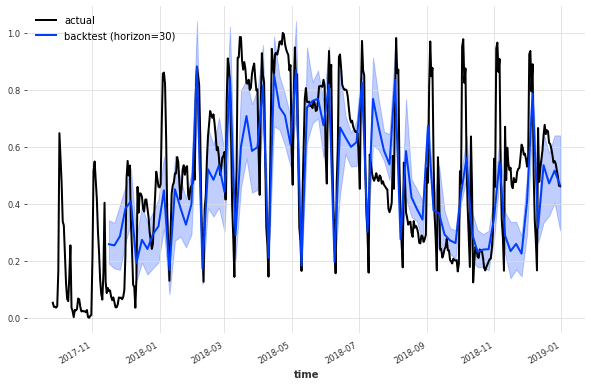
Probabilistic TCN forecast of energy production time series
Conclusion
Given the inherent uncertainty of most quantities humans are interested in predicting, it is crucial to quantify this uncertainty in an informed way. Darts provides the tools to do this in the form of probabilistic forecasting models. The idea behind these models is to represent a random variable parametrized by the input series, where the distribution of this random variable (once the model is trained) should approximate the distribution of the real-time series. Then, this random variable is represented as Monte Carlo samples to create what we call a probabilistic forecast. This forecast is subsequently used to compute statistics that help us quantify uncertainty in our forecast, namely quantiles and confidence intervals.