- Jul 6, 2021
- 6 min read
Written By
- Julien Herzen
Time series simply represent data points over time. They are thus everywhere in nature and in business: temperatures, heartbeats, births, population dynamics, internet traffic, stocks, inventories, sales, orders, factory production — you name it. In countless cases, efficient processing and forecasting of time series has the potential to provide decisive advantages. It can help businesses adapt their strategies ahead of time (e.g. if production can be planned in advance), or improve their operations (e.g. by detecting anomalies in complex systems). Although there exist many models and tools for time series, they are still often nontrivial to work with, because they each have their own intricacies and cannot always be used in the same way. At Unit8, we often work with time series and thus we started developing our own tool to make our lives simpler. We also decided to contribute to the community by open-sourcing it. In this article, we introduce Darts, our attempt at simplifying time series processing and forecasting in Python.
Motivation
If you are a data scientist working with time series you already know this: time series are special beasts. With regular tabular data, you can often just use scikit-learn for doing most ML things — from preprocessing to prediction and model selection. But with time series, the story is different. You can easily end up in situations where you need one library for pre-processing (e.g. Pandas to interpolate missing values and re-sample), another to detect seasonality (e.g. statsmodels), a third one to fit a forecasting model (e.g. Facebook Prophet), and finally more often than not you’ll have to implement your own backtesting and model selection routines. This can be quite tedious, as most libraries use different APIs and data types. And that’s not even mentioning cases involving more complex models based on neural networks, or problems involving external data and more dimensions. In such cases you’d likely have to implement the models yourself for your use-case, for instance using libraries such as Tensorflow or PyTorch. Overall, we feel that the experience of doing machine learning on time series in Python is just not really smooth, yet.
We are big fans of the scikit-learn approach: a single open-source library with consistent API that contains a great set of tools for end-to-end machine learning. Darts attempts to be a scikit-learn for time series, and its primary goal is to simplify the whole time series machine learning experience.
Darts is an attempt to smooth the end-to-end time series machine learning experience in Python
Show Me!
darts is open source and available here. You can install it in your favourite Python environment as follows:
pip install darts
The basic data type in Darts is TimeSeries, which represents a multivariate time series. It is mostly a wrapper around Pandas DataFrame, with some additional guarantees to ensure that it represents a well-formed time series, with a proper time index. It can easily be built, for example from a DataFrame:
import pandas as pd
from darts import TimeSeries

df = pd.read_csv('AirPassengers.csv')

series = TimeSeries.from_dataframe(df, 'Month', '#Passengers')
In the above snippet, we first read a DataFrame containing the air passengers dataset. We then build a (univariate) TimeSeries, specifying the time and value columns (Month and #Passengers, respectively).
Let’s now split our series in a training and validation TimeSeries, and train an exponential smoothing model on the training series:
from darts.models import ExponentialSmoothing

train, val = series.split_before(pd.Timestamp('19580101'))

model = ExponentialSmoothing()
model.fit(train)
prediction = model.predict(len(val))
That’s it, we now have a prediction over our validation series. We can plot it, along with the actual series:
import matplotlib.pyplot as plt

series.plot(label='actual')
prediction.plot(label='forecast', lw=3)
plt.legend()
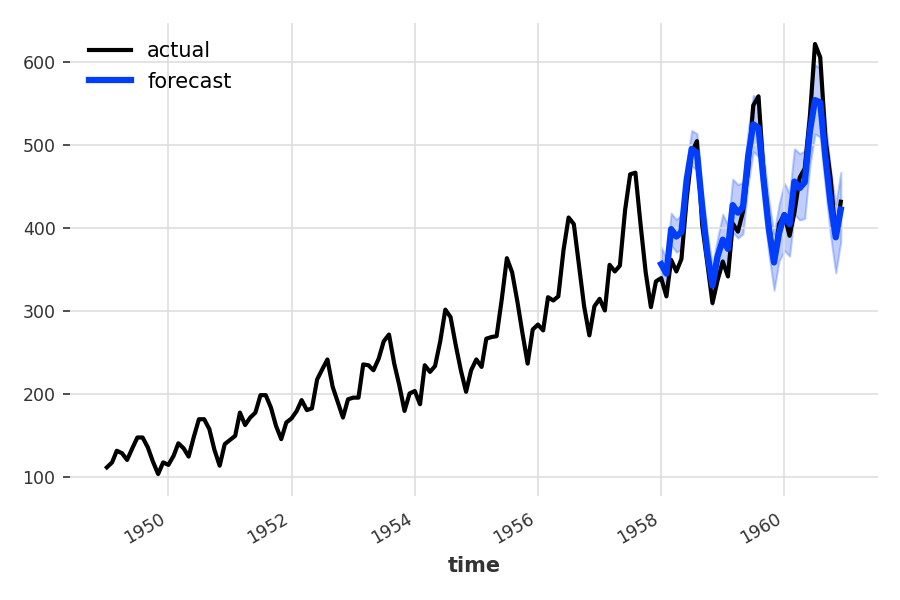
Forecasting the number of air passengers over 3 years (36 monthly values), using a simple exponential smoothing model.
That’s all it takes. Note that the plot contains confidence intervals. By default, if a TimeSeries is probabilistic, Darts will show its 5th and 95th percentiles (here the series is probabilistic because we called predict() with num_samples=500).
A Few More Details
As you may have guessed, we are mimicking the scikit-learn fit() and predict()pattern for training models and making forecasts. The fit()function takes in argument a training TimeSeries and the predict() function returns a new TimeSeries representing the forecast. This means that models manipulate TimeSeries, and this is pretty much the only data type being manipulated in Darts. This allows users to easily swap and compare models. For example, we could have just as easily used an auto-ARIMA model (which behind the scenes wraps around pmdarima):
from darts.models import AutoARIMA

model_aarima = AutoARIMA()
model_aarima.fit(train)
prediction_aarima = model_aarima.predict(len(val))
Basically, Darts is based on the following simple principles:
- There are two kinds of models. Forecasting models predict the future values of a time series given the past values, and regression models predict values of a target time series given a set of feature time series. The exponential smoothing and auto-ARIMA model we built above are examples of forecasting models.
- Unified
fit()andpredict()interface across all forecasting models, from ARIMA to neural networks. - Models consume and produce
TimeSeries, which means for instance that it is easy to have a regression model consume the output of a forecasting model. TimeSeriescan be either univariate (1-dimensional) or multivariate (multi-dimensional). Certain models such as those based on neural nets operate on multivariate series, while others are restricted to univariate series.- Immutability: the
TimeSeriesclass is designed to be immutable.
Darts already contains working implementations of the following forecasting models:
- Exponential smoothing,
- ARIMA & auto-ARIMA,
- Facebook Prophet,
- Theta method,
- FFT (Fast Fourier Transform),
- Recurrent neural networks (vanilla RNNs, GRU, and LSTM variants),
- Temporal Convolutional Networks (TCN),
- N-BEATS,
- and several naive baselines.
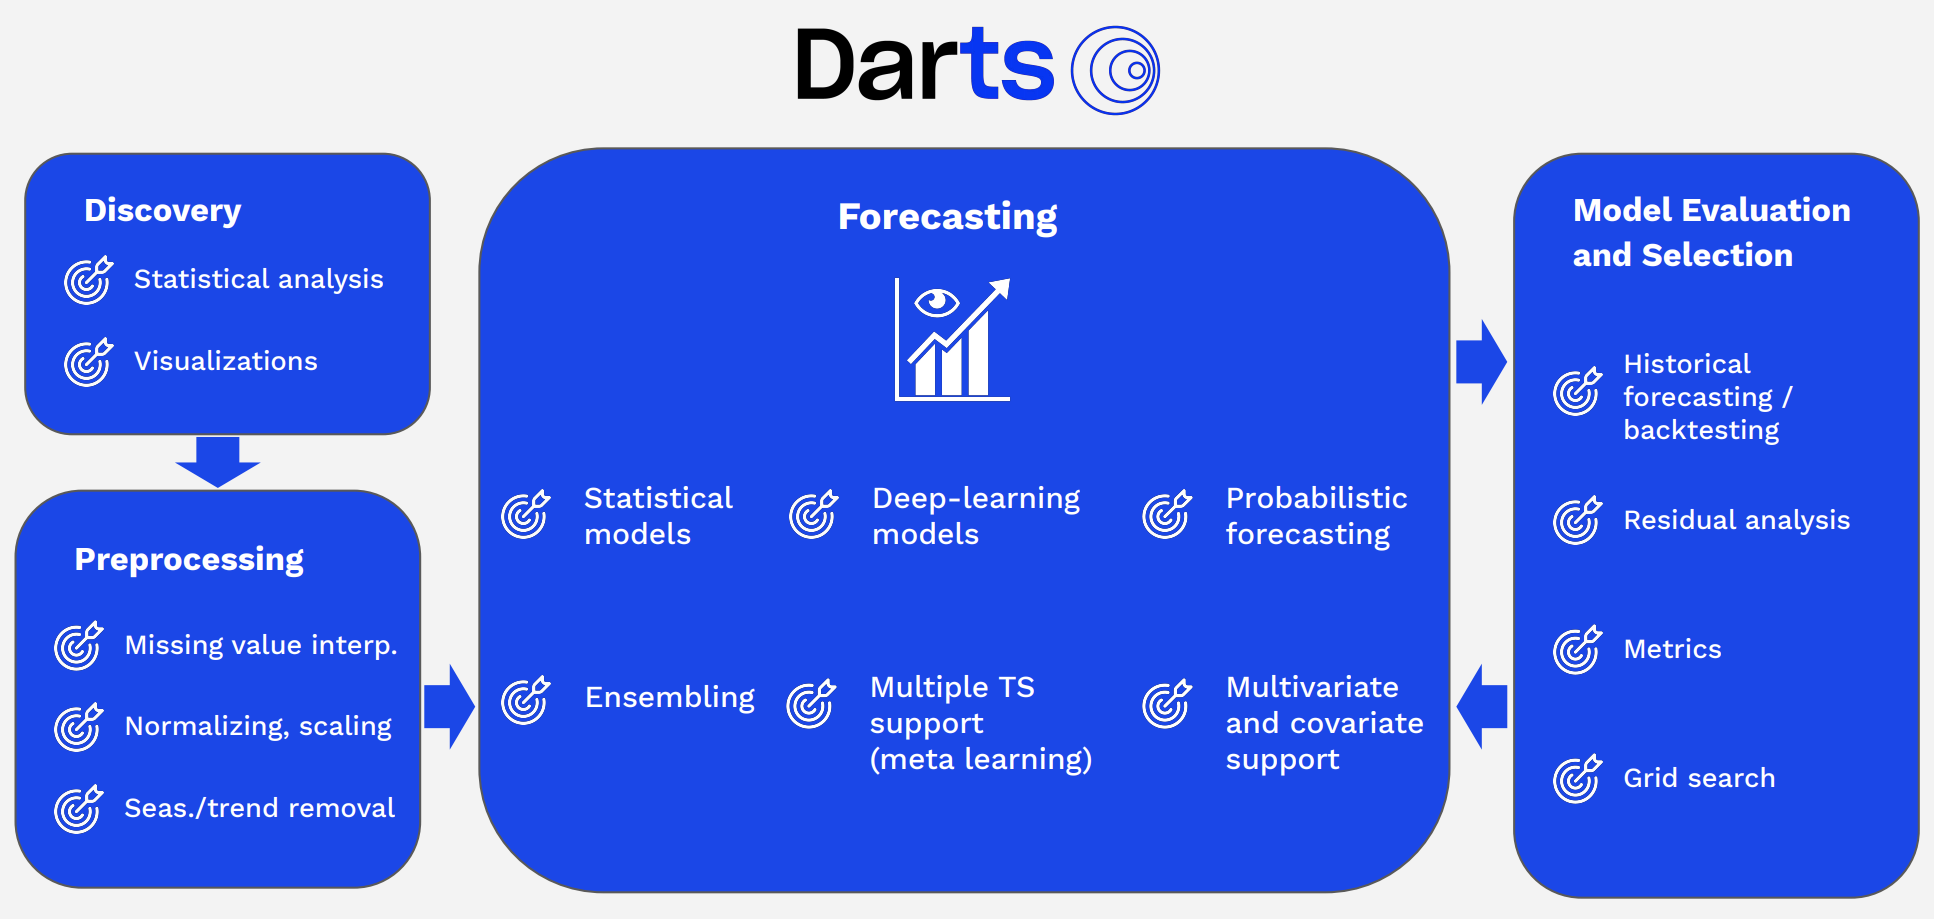
The library also contains functionalities to backtest forecasting and regression models, perform grid search on hyper-parameters, evaluate residuals, and even perform automatic model selection.
Darts has a strong support for deep learning models. These models provide richer functionalities, such as the ability to be trained on multiple series and covariates. This can simply be done by calling fit() with sequences of TimeSeries instead of unique TimeSeries. It can scale to large datasets and use GPUs.
In addition, the library also contains functionalities to backtest forecasting and regression models, perform grid search on hyper-parameters, pre-process TimeSeries, evaluate residuals, and even perform automatic model selection. Finally, it also contains some filtering models (such as the Kalman filter and Gaussian processes), which allow to perform probabilistic filtering and inference on time series.
Another Example — Backtesting
In our example above, we used Darts to obtain once a forecast over the next 36 months starting in January 1958. However, forecasts often need to be updated as soon as new data becomes available. With Darts, it’s easy to compute the forecasts resulting from such a process, using backtesting. For instance, using backtesting to compare two models looks as follows:
from darts.models import Prophet

models = [ExponentialSmoothing(), Prophet()]

backtests = [model.historical_forecasts(series,
                            start=.5,
                            forecast_horizon=3)
             for model in models]
The function historical_forecasts() is available on all models. It takes a time series, a starting point (here, we are starting at half of the series) and a forecast horizon. It returns the TimeSeriescontaining the historical forecasts would have been obtained when using the model to forecast the series with the specified forecast horizon (here 3 months), starting at the specified timestamp (using an expanding window strategy).
The return type is a TimeSeries, and so we can quickly compute error metrics — for instance here the mean absolute percentage error:
from darts.metrics import mape

series.plot(label='data')
for i, m in enumerate(models):
    err = mape(backtests[i], series)
    backtests[i].plot(lw=3, label='{}, MAPE={:.2f}%'.format(m, err))

plt.title('Backtests with 3-months forecast horizon')
plt.legend()
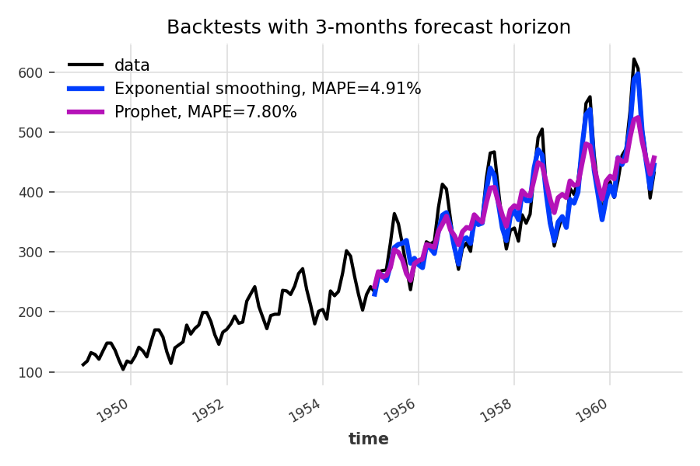
Backtesting forecasting models — here we simulate making forecasts with a 3 months horizon, every month starting in January 1955 (so the first forecast value is for April 1955).
In addition, because the return type of historical_forecasts() is a TimeSeries, we can also simply consume the outputs features series in regression models, which can serve to ensemble (stack) the forecasts made by several models, and potentially also include external time series data. All the models also have a backtest()function that works similarly, but directly returns the distributions of errors (for a desired error function) instead.
There is a lot more that we did not cover here. We provide a series of example notebooks covering more material. For instance, you can look at the intro notebook, or see how to easily train RNNs or TCNs neural networks using the fit() and predict() pattern. In addition, we also recommend consulting the Darts documentation and watching our introductory video:
Training Models on Multiple Time Series
It is possible to train some Darts models on multiple time series, optionally using covariate time series as well. We have covered these features in more details in a dedicated article.
What Next?
We are actively developing Darts and adding new features. For instance here are a couple of things on our roadmap:
- Outlier-detection functionalities
- Time series embedding and clustering capabilities
We are welcoming contributions and issues on github. This is also the best place to get up-to-date information on the library.
Finally, Darts is one of the tools we are using internally during our day-to-day AI/ML work for several companies. If you think your company could benefit from time series solutions or have other data-centric issues, don’t hesitate to contact us.
Thanks to Kamil Zalewski, Francesco Lässig, Gael Grosch, and Marek Pasieka.